Demonstrator: Gas Export Pipeline with HIPPS

To demonstrate a probabilistic digital twin, we consider a gas export pipeline with a high-integrity pressure protection system (HIPPS). Flow is maintained by a compressor at the platform side and depends on the compressor power and outlet pressure. The pressure rating of the pipeline is lower than the maximum pressure the compressor can deliver. Hence, in the event of blockage, the compressor must shut down and the pipeline must be isolated. The HIPPS is introduced as a safety barrier, in addition to the process control system (PCS), to block the flow before the pressure builds up to a level where the pipeline may burst. The system is illustrated in Fig. 4. In this demonstrator, the probability of burst in the event of blockage is the objective of the risk analysis. Importantly, this demonstrator illustrates that safety (i.e. related to burst risk in this example) is not simply correlated to reliability of safety systems, but also depend on other factors, such as how the system is operated.
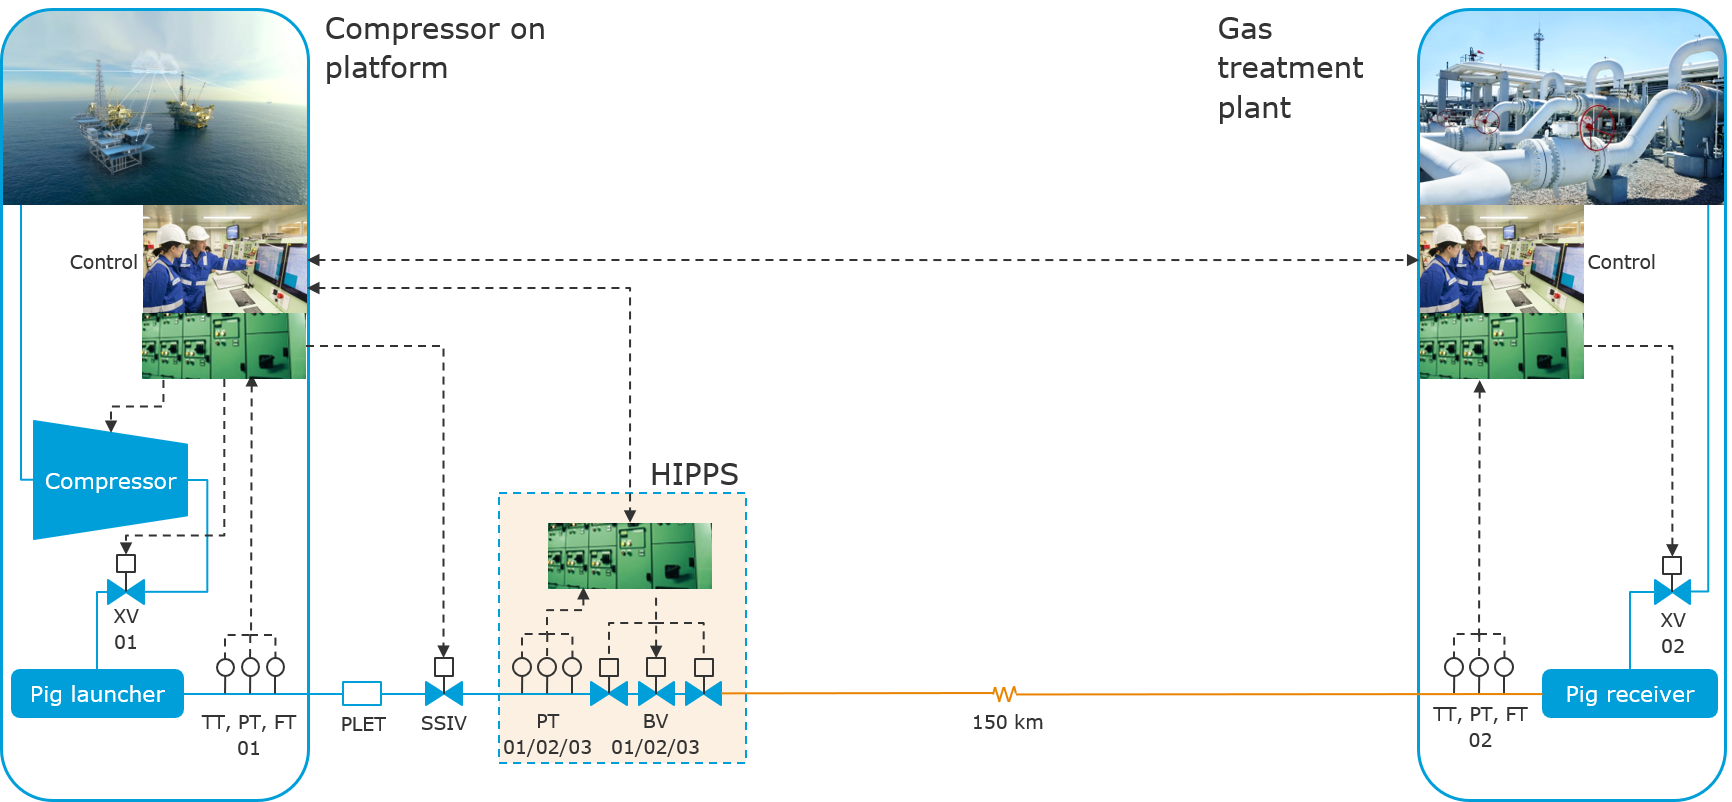
Fig. 4 Overview of the physical system: a gas export pipeline (red) with a high-integrity pressure protection system (HIPPS).
A mock-up digital twin of this system was constructed, consisting of a Modelica model of the pipeline system (shown in Fig. 5), together with synthetic process data for two gas pipelines with different operation profiles.
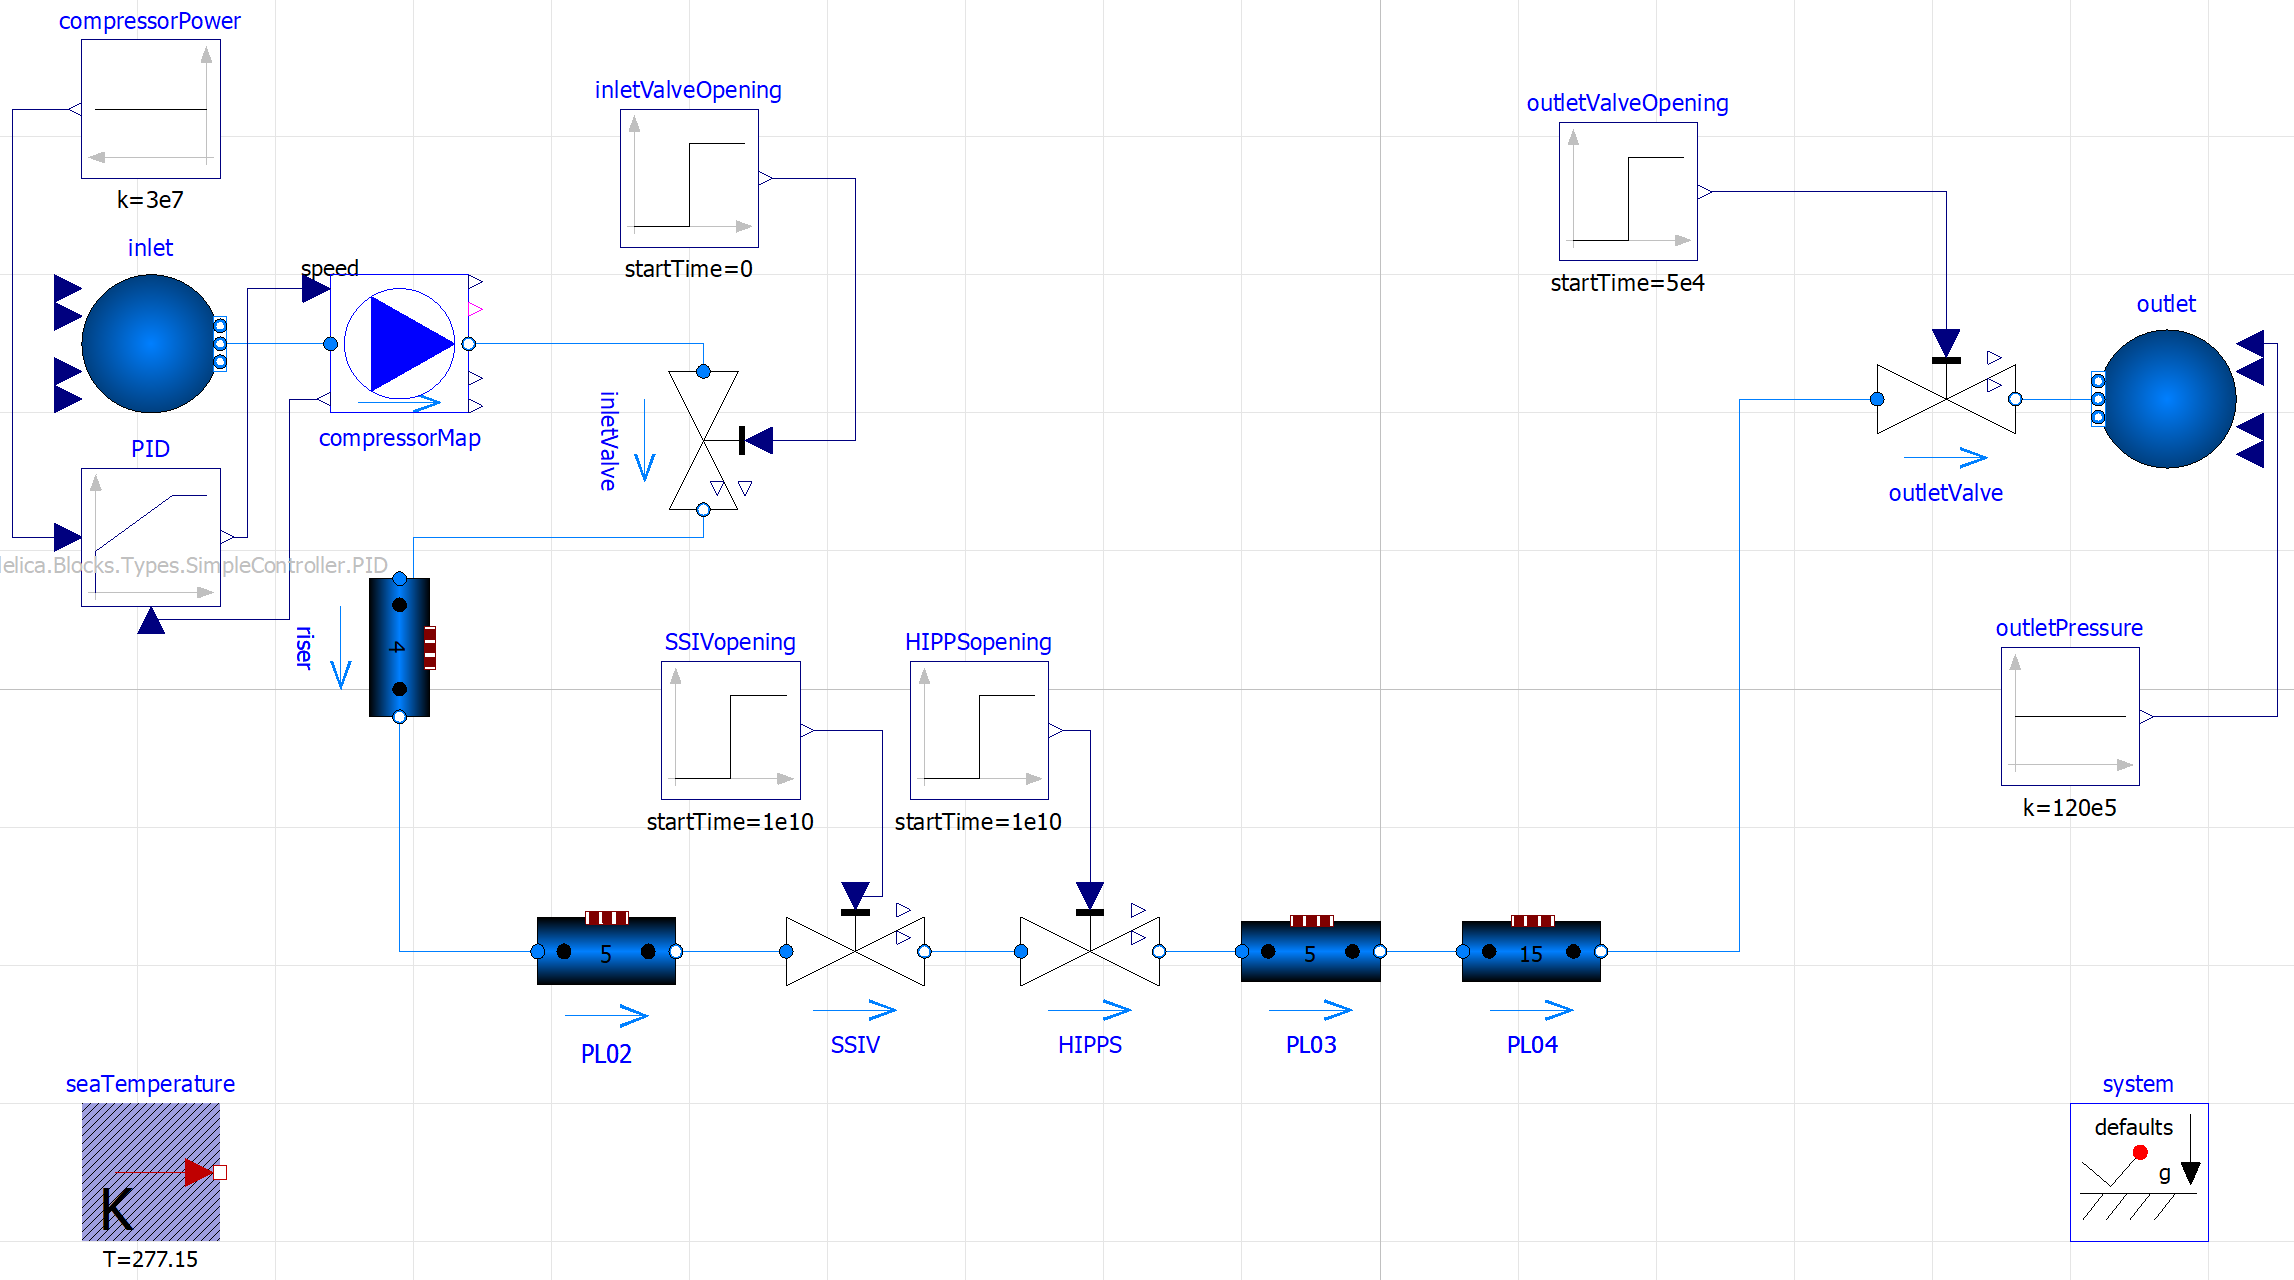
Fig. 5 Modelica model of the system shown in Fig. 4.
Gaussian process regression was used to create surrogate models from the Modelica process model in Fig. 5, to enable fast approximations of the volume flow and pressure in the pipeline as a function of compressor power and outlet pressure (under steady flow and blockage conditions). While the Modelica simulation takes minutes to run for each scenario, the Gaussian process surrogate model is instantaneous. An example of a Gaussian process surrogate model relating compressor power and outlet pressure to the internal pipeline pressure under steady flow conditions is shown in Fig. 6.
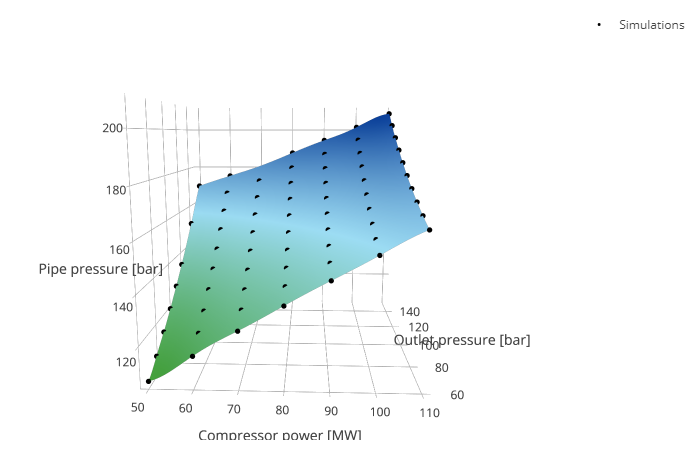
Fig. 6 Example of a Gaussian process surrogate model for steady state pipeline pressure as a function of compressor power and outlet pressure. The displayed surface represents the mean prediction while each black point corresponds to a full computer simulation of the Modelica model.
Fig. 7 shows the logic model for a pipeline burst scenario. The burst of the pipeline depends on the structural strength of the pipeline and the ability of the compressor to pressurize the pipeline to this level. Two safety barriers exist to prevent this from happening: (i) the process control system (PCS) which should activate at a pressure of 210 bar, and; (ii) the high-integrity pressure protection system (HIPPS), which should activate at a pressure of 230 bar.
The structural capacity of the pipeline is based on structural reliability calculations, and the grey band in Fig. 7 indicates the estimated structural strength with uncertainty (i.e. 239 bar  10 bar standard deviation).
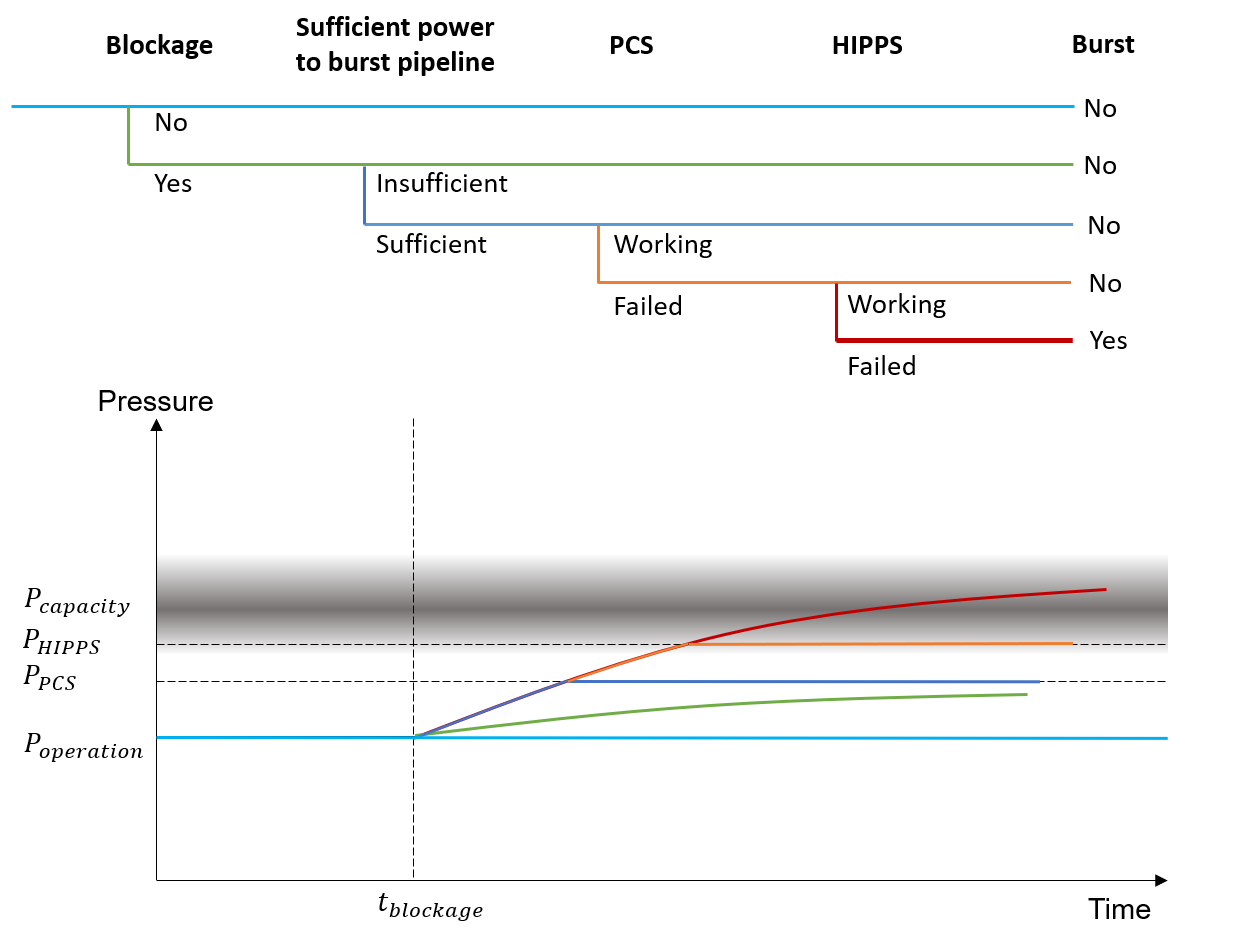
Fig. 7 Logical model for pipeline burst scenario.
Fig. 8 shows a Bayesian network (BN) model, which encodes the logical model in Fig. 7 and combines knowledge from the flow model and flow data in the digital twin (via Gaussian process surrogate models, such as the one shown in Fig. 6) with a structural reliability model for the pipeline and system reliability models for the PCS and HIPPS. Note how the Bayesian network combines knowledge from three domains which have traditionally been treated separately: structural reliability, flow process modelling and safety system reliability. In principle, models for the degradation of the pipeline’s structural capacity (e.g. fatigue and corrosion processes) could also be included, but this was not addressed in this demonstrator, which rather focuses on the dynamics of the loads on the pipeline.
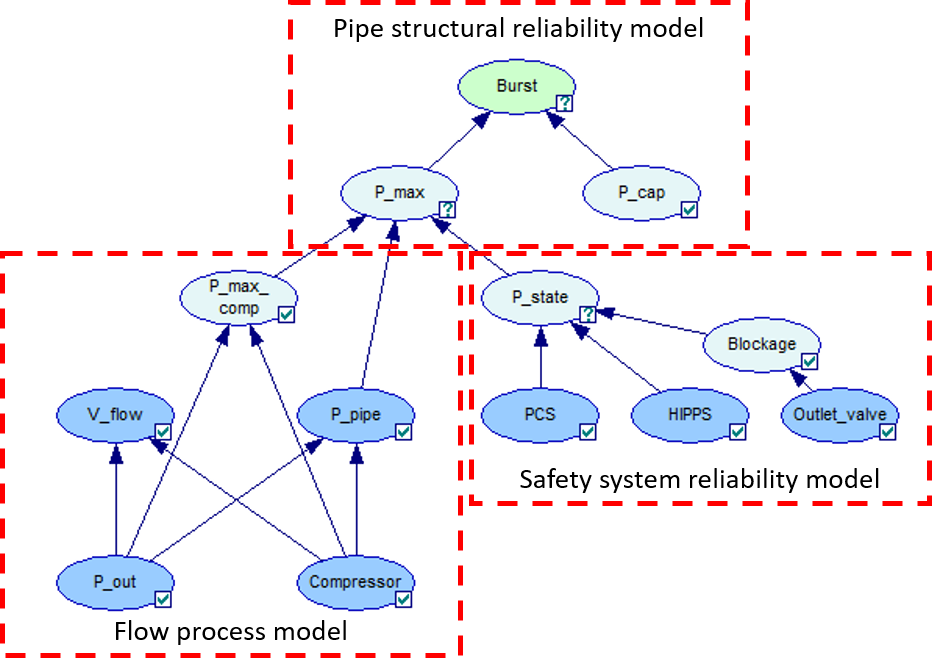
Fig. 8 Bayesian network, coupling the elements of a probabilistic digital twin (i.e. logic and relational model for burst scenario, surrogate models for the flow process model from the digital twin, and failure models for the pipeline and safety systems).
An interactive web application is shown in the next section, demonstrating how burst risk may be monitored in real time using this probabilistic digital twin. The app lets operators explore how risk is affected by operating conditions and can be used to control risk in operation. The application computes the probability of pipeline burst as a function of time, conditional on the flow conditions and conditions of the safety systems. The periodic decreases in the burst probability correspond to knowledge gained from periodic testing of the HIPPS. Note that burst risk reduces to zero when the compressor power is well below what is needed to reach the burst capacity (e.g. during shut-downs).
Two pipelines with different operating history can be selected, to illustrate how different operation scenarios affect the real-time risk. The user may also probe the effects of different operation and testing strategies by tuning selected model parameters and inspection intervals. A default forecast shows the risk assuming operations remain the same, and a second scenario forecast shows the effect on the risk if the HIPPS is degraded, or if operational parameters are altered or test intervals are changed. In this way, the effect on production availability and risk may be evaluated in conjunction and in real-time, helping operators find better strategies to manage risk based on actual conditions and use scenarios.